A newbie’s guide to geometric morphometrics for biology, and an analysis of Disney faces.
I am going to use geometric morphometrics to prove that Disney princesses are all the same, and that Disney has a (consistent) face for evil.
If you have used geometric morphometrics before, then this post probably isn’t for you. Unless of course, you want to find out the secrets to Disney faces, in that case, carry on. I am going to take you through the general concepts on geometric morphometrics, and show you a practical example. I will introduce you to some open source (hooray for free) software that can be used to do an analysis. There are links for all of these at the bottom of the page. There are a lot of online help sources for all of them, so if you get stuck, an easy google search will help in most cases.
I have the data files and a power point for this entire process, if you would like them, then just get in contact with me via email, I’m happy to share.
Disclaimer! I know that there are dozens of ways to do this. I just want to show you some of them. This article is not an all-encompassing review of this technique. It is meant to be a light hearted and gentle introduction to the scope of the interesting, but sometimes confuddling, method.
So, firstly, what it is? Geometric morphometrics translates in to “differences in shape measures”. Morphometrics is a greek word. μορϕή -morphé“ – meaning shape or form and μετρία –metría” – meaning measurement. What we do is turn shape in to numbers, then we test the numbers.
What’s it for? It is an objective technique for assessing shape and changes in shape. It can be 2D or 3D, this example is 2D.
Who can use it? Anyone with photographs and a computer.
We will solve a question together. Have you ever wondered, are all Disney princesses the same? And how do we always know who the bad guys are – Is it because they have a certain “look”? Yes, we are going to do a geometric morphometric analysis of Disney faces.
So, first thing we need – Disney faces! Now this is actually a little harder than it sounds. The main criteria for an image for this type of analysis is that the images are all in the same plane. E.g., (as in this case) face on. It won’t be accurate if they aren’t from the same angle. It doesn’t matter if one is bigger than the other, or if one is at a funny angle, but it does matter that you can see all of the same things in every photo.


Gaston is ok, Aladdin is fine, Genie is not. It’s nothing personal, I quite like the Genie, but his face is distorted, and if we analyse it, then it will give a false impression that his face is squiffy.
We get a choice next; do we want to look at the relationship of features to each other, or do we want to look at the overall head shape? The individual features means that we can see of those princesses really do have giant eyes and no noses. If we do an outline analysis we can tell if the villains’ heads really are long and skinny. These processes both involve landmarks. A landmark is a position on an image that references something of interest. The facial features analysis uses discreet landmarks, the outline analysis makes use of semilandmarks. Discreet landmarks are independent of each other, the semilandmarks are used on curves and landmarks, and their position on that line depends on where the other landmarks are.
I’m going to show you how you can do both, but I will take you through the discreet landmarks process from start to finish first. I use a programme called ImageJ for this.

Before you start, choose the landmarks that you want to use. The landmarks you choose should meet the following criteria
Be present on everyone
Be clearly defined
Be relevant
In this example I have used the top and bottom of the face, the top, bottom, left and right, of the eyes and lips. I put landmarks at the bottom of the nose, I was going to do the top of the nose, but it turns out the princesses don’t have them. I also put landmarks at the widest part of the face.
Open your image and select the multipoint point tool and click on the face where you want your landmarks to be. You must click in the same order every time.
![]()
All clicked up then? Now we save it as X,Y co ordinates. Remember that, we will use it later.

Now we have a whole heap of text files, if you open them, they look like this –
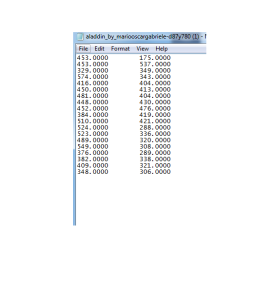
Those are X Y coordinates.
Firstly, we need to put all of the landmark co ordinates in to a single file. I use MS Word, you can use Excel or notepad ++. Your choice. You need to change the tabbed landmarks in to a single string of text for each individual. I use find and replace. With “^t” and “^p” replaced with “, “. In the end it should look like this:
Individual name, x, y, x, y, x, y

The length of the strings will vary depending on the number of landmarks you have, but there should be the same number of landmarks for each individual. Save it as a .txt
The next program I use is MorphoJ. This is where the analysis starts <insert cheering sounds>. Create a new project with your .txt file.

Head hitting desk warning! MorphoJ has a silent error. That means that if there is a mistake in your file, it won’t tell you, it just won’t load. Breathe. We can fix this. From my own many mistakes, it usually means that there is a double comma, or something simple. You can trouble shoot this by adding the funny mark up things in word, or opening it in excel. If it works, it looks like this:

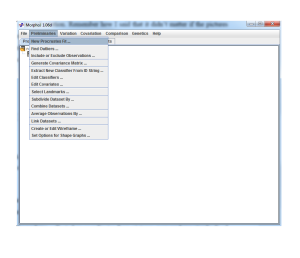
Next up, go the project window and pick your project (it says ‘new project”). We are going to do a Procrustes fit.
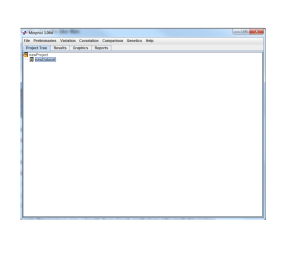
This is optimally translating rotating and uniformly scaling the objects. In English, it removes size and rotation. Remember how I said that it didn’t matter if the pictures were different sizes or if one was a bit squiffy? It’s because we are going to remove that effect. It centres all the xy coordinates around a (0,0) coordinate. It then puts everything on a generic scale. Now, I’m not saying size doesn’t matter. It’s just that size can be quite dominating, we might miss the other differences if we include it. So in this case, we are getting rid of it. Totally up to you though.

Side note Procrustes was a bandit from Greek mythology who made his victims fit his bed either by stretching their limbs or cutting them off (seriously, google it!).
So far we have collected xy coordinates from pictures, now we have standardised them. Now for the maths! <more cheering>. If you’d like a more in depth explanation of the maths, have a look at the bottom of the page. If not, read on.
Generate a covariance matrix (look at the maths section if you’d like to know what it is). We need this to do the most interesting part of the stats – principal components analysis.
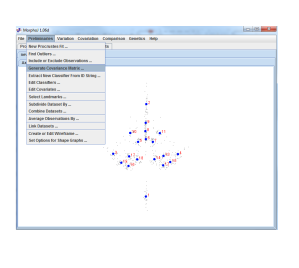
The PCA will tell us which differences in the shape are responsible for how much of the variation. The analysis splits up the shapes in to principal components (PC). PC 1 shows the most variation, PC 2 shows the next biggest, and so on. Here, the first two PCs show more than 60% of the variation between the faces. If you get really low variance, then the landmarks you’ve chosen aren’t capturing the shape variation, or there is no variation.
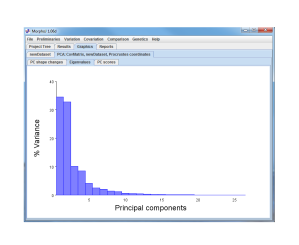
When you do a PCA (under the variation tab) in MorphoJ you get a picture that looks something like this:

It might be upside down (right click and you can flip it). Looks weird. This is a scree plot. It is also known as a lollipop graph. Each of those circles is the average position of the landmarks that you picked out imageJ. If we link the landmarks, it might look a bit more familiar. Yep, it’s an average of what all Disney faces look like.
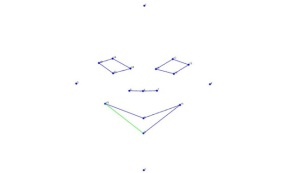 (I don’t know about you, but I find it a bit unsettling)
The sticks of the lollipops tell us which way things change along the principal components. If an individual has a high PC score, then their shape is further down the stick. Let’s have a look at how our Disney faces plot out on PC1 and PC2, this graph is often referred to as morphospace. If two faces are close on the graph, they similar in shape and in morphospace. If a category, e.g. female villains, have a big spread, then they have a wide distribution in morphospace.
The lollipop graph for PC 1 is on the right, next to Yzma, the one for PC 2 is on the left, next to Jafar. Let’s look at PC 1 first. The lollipop graph shows that the biggest variation in the faces along this PC is the edges of the mouth going up, and the cheeks get wider, we know this because this is where the biggest sticks are. Look at Yzma and Ursula, they are the most extreme version of this, which is why they are on the most positive end of PC 1. Now let’s look at the lollipop graph for PC 2. The eyes go up and in, and the chin goes down. Now look at Jafar.

I don’t know how well you know your Disney characters, but the more cartoon inclined amongst you might notice something. That little cluster in the middle is almost entirely good guys. All of the ones around the edge are villains. It seems to be that the extreme face shapes belong to the baddies, and there isn’t much difference between the goodies.
Now we just need to prove it. Firstly you will need to export those PC scores. They’ll save as a .txt file. We will import these in to our final piece of software, PAST, a palaeontological statistics program. We need to categorise the rows in to our areas of interest. I chose good and bad, male and female. Pick a colour/symbol for each category, and put all of the same categories together.

Now for the stats <crowd goes wild>! Highlight the PCs you want to analyse. Then choose the statistics you want. I do non-parametric multiple analysis of variance (NPMANOVA) and analysis of similarity (ANOSIM), with Euclidean distances. Have a look at the maths section to learn more. The tests are under the multivar menu and it looks a bit like this.

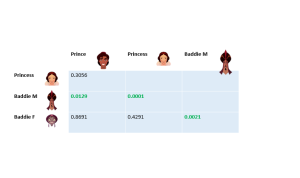
There is an overall test summary at the top. The box at the bottom is the pairwise comparisons. The heading are the name of the individual that is first in the list.
The NPMANOVA give us an overall value, and pairwise comparisons (P = 0.0001, F = 9.12). So there is a significant difference between types of Disney faces! Let’s look a bit closer at the pairwise comparisons, below. The female villains and princes are not different from each other. Now, this doesn’t mean that they are the same. Look at the graph again, the female villains are all over the place. Interestingly, the princesses are all in the same place, even though I used a range of princesses. It seems to be the case that the good ones are all the same, and the bad ones are the “unusual” faces.

In past you can make a graph with convex hulls, so you can see the overall occupation in morphospace.

So there you go, that’s how you do morphometrics, with Disney. As a final thought, I made the “average face” of each of the categories. You can do this by only including them in the MorphoJ file. See if you can guess which is which:


Outlines
The semilandmark analysis is the same as the discreet landmarks once you have your x y coordinates. This one I like to do in a program called TPSdig2. It’s a lovely little program that does it for you. I like everything that means it is fast and objective. We will get to how to do it in just a moment. TPSdigs2 works really well on picking out outlines on black and white images. The examples that we have here aren’t black and white. Please excuse a brief interlude while I show you one of my favourite pieces of free software, GIMP (careful with the google search of that).

GIMP is very similar to a better known and more expensive photo alteration software. I use it to quickly create silhouettes of things. When you open GIMP, open your image, and then create a new layer.
What’s a layer? These are things that you can turn visible and invisible in an image. We will add a layer and make another layer invisible, so we end up with a black and white image. As I was saying, add a new layer, Crtl-shift-n. Now pick the pencil tool and draw around what you would like.

Pick the paint bucket, you may experience early nineties flashbacks at this point, fill in the image. At the bottom of the tools things you can swap the colours, make the back ground white. Now Crtl-shift-E to export it. Pick PNG or JPG. Ta da! You have a silhouette.

Back to TPSDig2. Open your black and white image. On the toolbar that the top you will see something that looks like a lasoo with an arrow on it (I put an arrow on it in the photo). That is the “auto outline” tool. Pick it. Now pick the point where you want your outline to start. It has to be the same place in every picture. By the same place, I mean the same place on the outline, in this case, a head. I picked the middle of the top of the head. If the head was at a jaunty angle, I would still pick the same place on the head, not on the photo.
Right click and pick “save as x y coordinates”, sounds familiar, right? When you pick this, you will get an option of how many landmarks you want. You want enough so it gets all the features, not so many that it thinks pixels are important. Have a play, you’ll get a red outline when it is done (I used 250). If that outline looks like the figure you want, then you can crack on. Just make sure that you use the same number of landmarks for every individual.

Now you do the same steps as you did above. Create a single text file, and open in it morphoJ. Do the Procrustes fit, generate the covariance matrix, do the PCA.
The outlines results are a bit different from the features results, the biggest change (PC 1, the lollipop graph on the right), is the long and thin faces of the male villains at one end of the axis, and the wide, almost triangle heads of some characters, look at Elsa and Yzma. PC 2 is a bit odd (the lollipop on the left), the chin is a bit wider, the forehead is a bit lower.

The stats on this show an overall significant difference in the outline of head shapes of different types of Disney character. If we look at those pairwise comparisons, we can see that it is those long and skinny male villains that are responsible for it all.
So, there you go.
Geometric morphometrics has shown us that there really is a difference between the good and the bad.
I hope you enjoyed reading this as much as I did making it.
Sam
Maths (for those who are inclines)
Procrustean superimposition is an orthogonal transformation using sum of squares of shapes. It centres all shapes at an origin, rotates them around this origin, so that the sum of squares differences between the landmarks is minimised, and scales all of them to a unit scale (Rholf 1999). This removes the cumulative effects of size, and shape. The results is that the x,y coordinates from the landmarks are reflective of pure shape differences between different taxa.
PCA is an orthogonal transformation multivariate analysis technique (Wold et al 1987) and was carried out on the variance-covariance matrix in order to determine the areas of most variation. PCA is a useful technique to show patterns in data (Smith 2002). Using covariance means that the analysis is no longer one dimensional, we can look the data in relation to each other, making it two dimensional (Smith 2002). This is used to build the covariance matrix, which provides the foundations for the eigenvector and eigenvalue calculations. The eigenvector is the direction of the line of most variation, the eigenvalue is the variance of the data in that direction.
The resulting PC scores show the relative position of individuals in morphospace. The first PC is the one that encompasses the most variation between the taxa, it is the direction where the distance is greatest, based on eigenvalues and eigenvectors.
Scree plots (also known as lollipop graphs) were used for interpreting the first three principal components of each analysis. The plots show a centre point, which is average position of each landmark, and a line that shows both the magnitude and direction of change. The further along the positive direction of the PC axis, the further down the “line” the individual taxa occupy.
NPMANOVA produces F and P values, with the same principles as the ANOVA (Anderson 2001), using distance measures to test for differences between groups. The significance of the test results from 10000 permutations of group membership.
ANOSIM uses the mean rank of all distances between group and the mean rant of distances within groups, producing an R and P value. R is between 0 and 1, where a value of 1 is complete dissimilarity between the groups (Clarke 1993), as with the previous test, the significance is computed by permutation of group membership.
Downloads
ImageJ
http://rsb.info.nih.gov/ij/download.html
MorphoJ
http://www.flywings.org.uk/morphoj_page.htm
Past
http://nhm2.uio.no/norlex/past/download.html
Gimp
PCA for dummies
